The internal Oozie instrumentation increments counters for various coordinator related actions. Graphing a subset of these counters by utilizing oozie-graphite gives you a good visualisation of your coordinator actions waiting for data to become available and if these dependencies were finally fulfilled or if they did timeout eventually.
The internal Oozie instrumentation increments counters for various coordinator related actions. Graphing a subset of these counters by utilizing oozie-graphite gives you a good visualisation of your coordinator actions waiting for data to become available and if these dependencies were finally fulfilled or if they did timeout eventually.
Prerequisites
This tutorial is based on our oozie-graphite project (hosted on Github). This blog post will not cover basics like installation or configuration of these Oozie extensions, so please consult the project’s wiki or this previous blog post on how to install and configure the GraphiteInstrumentationService.
  * Oozie server with [GraphiteInstrumentationService](https://github.com/syscrest/oozie-graphite/wiki/GraphiteInstrumentationService) enabled and configured
  * Active coordinators / bundles
  * Grapite server
Set up your graph
Add .counters.commands.coord_action_input.executions, .counters.commands.coord_action_timeout.executions and .counters.commands.coord_action_ready.executions metrics into one chart and make sure to apply the transformation derivative (Because the raw metric it the total number of execution since Oozie startup and pretty useless when graphed directly).
Your graph data definition should look like this:
derivative(<your-metrics-prefix>.counters.commands.coord_action_input.executions)
derivative(<your-metrics-prefix>.counters.commands.coord_action_timeout.executions)
derivative(<your-metrics-prefix>.counters.commands.coord_action_ready.executions)
Example graph
The chart below shows an Oozie instance with a single bundle deployed with multiple coordinators:
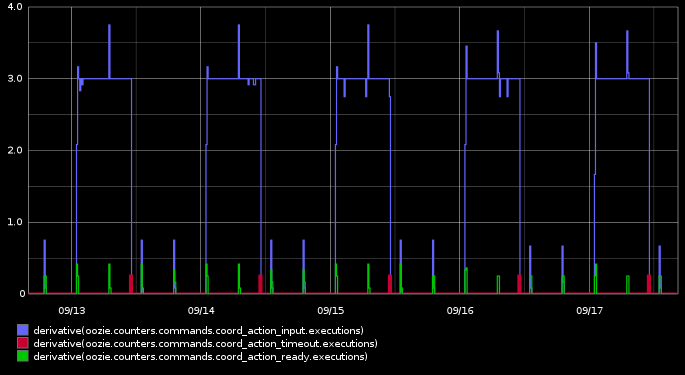
Please note: coord_action_timeout.execution was enhanced by an additional color(lineWidth(derivative(…commands.coord_action_timeout.execution),3),“red”) to increase its visibility
Some coordinators are processing data every 6 hours (from the last 6 hours, always available immediately) and there are a couple of coordinators running every 24 hours to process data from the last 90 days (which are not fully available and are causing problems). Every six hours there are data availability checks coord_action_input (= blue line) executed and immediately followed by coord_action_ready (=green line) actions because all input dependencies are met … great ! But every 24 hours Oozie is re-evaluating input data availability (coord_action_input) over and over again for nearly eleven hours. Oozie stops looking for this data after coord_action_timeout (= red line) spiked, so these coordinator actions did indeed timed out.