The internal Oozie instrumentation keeps track of average execution times for each action type. Graphing a subset of these metrics by utilizing oozie-graphite gives you a good visualisation of your coordinator action performance, especially if you are running custom oozie actions.
The internal Oozie instrumentation keeps track of average execution times for each action type. Graphing a subset of these metrics by utilizing oozie-graphite gives you a good visualisation of your coordinator action performance, especially if you are running custom oozie actions.
Prerequisites
This tutorial is based on our oozie-graphite project (hosted on Github). This blog post will not cover basics like installation or configuration of these oozie extensions, so please consult the project’s wiki or this previous blog post on how to install and configure the GraphiteInstrumentationService.
  * Oozie server with [GraphiteInstrumentationService](https://github.com/syscrest/oozie-graphite/wiki/GraphiteInstrumentationService) enabled and configured
  * Active coordinators / bundles
  * Graphite server
Background - oozie timers
Oozie creates so called Timers for each executor/action type that is used in your workflows, capturing each method (e.g. start() , stop(), …) separately.
action.executors - Counters related to actions:

    [action_type]#action.[operation_performed] (start, end, check, kill)
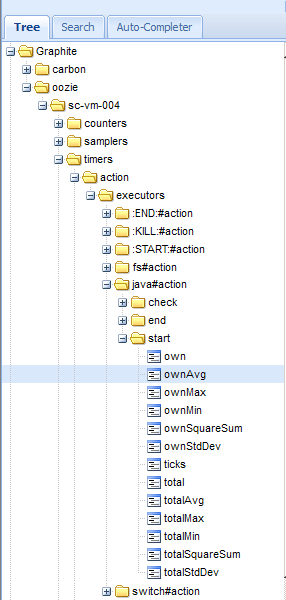
oozie-graphite transforms these timer metrics [action_type]#action.[operation_performed] into a list:
...#action.start.own
...#action.start.ownAvg
...#action.start.ownMax
...#action.start.ownMin
...#action.start.ownSquareSum
...#action.start.ownStdDev
...#action.start.ticks
...#action.start.total
...#action.start.totalAvg
...#action.start.totalMax
...#action.start.totalMin
...#action.start.totalSquareSum
...#action.start.totalStdDev

(own = time spend on own processing)
(total = time spend total)
Picking .start.ownAvg as the average execution time in milliseconds of the start() method enables you to graph the full execution time for synchronous actions (like switch of filesystem actions) or submit time for asynchronous actions (like map-reduce or java action).
Example graph
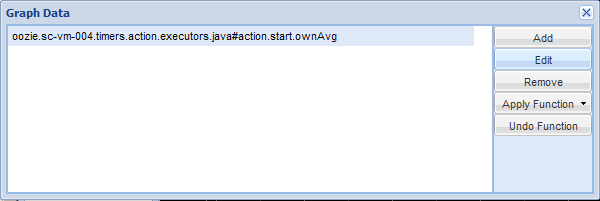
We start by selecting :
<your-prefix>.timers.action.executors.java#action.start.ownAvg
These timers are not available immediately, because they are created only if a executor/action type was executed at least once by a workflow. So make sure your oozie instance is actually stepping through some workflows, otherwise your metrics tree beneath .timers.action.executors.* would be empty.
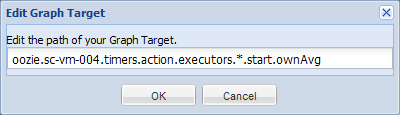
Hint: Manually edit your “Graph Data” to gather all available start performance metrics in one graph:
Replace java#action with ***** (or explicitly add futher metrics from your metrics tree):
example chart:
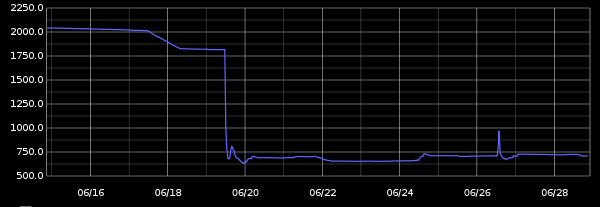
You can see that map reduce submit times decrease significantly from approx 2 seconds to 0.75 seconds.