This is the first post about GraphiteMRCounterExecutor use cases: we start by utilizing already available hadoop counters that deliver very valueable graphs.
This is the first post about GraphiteMRCounterExecutor use cases: We start by utilizing built-in hadoop counters that deliver very valuable graphs (with minimal modifications to your existing mapreduce code / coordinator / bundle setup).
Prerequisites
You need:
  * Oozie 3.3.x server with oozie-graphite's GraphiteMRCounterExecutor module installed (see [this blog post](/2013/10/oozie-bundle-coordinator-monitoring-installing-graphitemrcounterexecutor/) for detailed install instructions)
  * Graphite server
  * a bundle / coordinator to enhance
Background - hadoop counters
The mapreduce framework keeps track of a number of things per default, so you will find these counters for every map reduce job you run on your cluster:
No java code changes are neccessary for this to work!
Modifing the coordinator
The additional action node that we will add to the workflow needs access to the nominal time associated with the coordinator action. So if it was not already available, just add
 <property>
  <name>nominalTime</name>
  <value>${coord:nominalTime()}</value>
 </property>
to your the workflow configuration block within the coordinator definition (or just use existing variable and leave your coordinator untouched).
Your coordinator may now look like this:
<!--- keep the coordinator frequency in mind -->
<coordinator-app frequency="${coord:hours(1)}" ....>
 <action>
  <workflow>
   <app-path>...</app-path>
   <configuration>
    ...
    <!-- pass the nominal time into your workflow -->
    <property>
     <name>nominalTime</name>
     <value>${coord:nominalTime()}</value>
    </property>
    ....
   </configuration>
  </workflow>
 </action>
</coordinator-app>
Modifing the workflow
We need to add a new action node to your workflow that will grab the counters from your map reduce job and pushes this data into your graphite instance.
Your original workflow may look like this:
<?xml version="1.1" encoding="UTF-8"?>
<workflow-app xmlns="uri:oozie:workflow:0.2" ....>

	<start to="mr-job" />

	<action name="mr-job">
		<map-reduce>
			....
		</map-reduce>
		<ok to="end" />
		<error to="fail" />
	</action>

 <kill name="fail">
  <message>workflow failed</message>
  </kill>

  <end name="end" />

</workflow-app>
Add a new graphite-mr-counter action node after your map-reduce action (but not necessarily directly after the node) into your workflow:
<?xml version="1.1" encoding="UTF-8"?>
<workflow-app xmlns="uri:oozie:workflow:0.2" ....>

	<start to="mr-job" />

	<action name="mr-job">
		<map-reduce>
			....
		</map-reduce>
		<ok to="graphite-transmit" />
		<error to="fail" />
	</action>

<action name="graphite-transmit">
 <graphite-mr-counter xmlns="uri:oozie:graphite-mr-counter-action:1.0"
   graphite-host="graphite.your.org"
   graphite-transport="TCP"
   graphite-port="2003"
   metrics-path-prefix="oozie.bundle-name.coordinator-name"
   nominal-time="${nominalTime}">
  <counter>
	<source>${hadoop:counters('mr-job')['org.apache.hadoop.mapred.Task$Counter']}</source>
	<!-- this mapping will add a prefix ("mr_framework.") to all counters -->
	<mapping matches="(.*)" rename-to="mr_framework.$1" />
  </counter>

  <counter>
	<source>${hadoop:counters('mr-job')['org.apache.hadoop.mapred.JobInProgress$Counter']}</source>
	<!-- this mapping will add a prefix ("job.") to all counters -->
	<mapping matches="(.*)" rename-to="job.$1" />
  </counter>
  <counter>
        <source>${hadoop:counters('mr-job')['FileSystemCounters']}</source>
        <!-- this mapping will add a prefix ("file_system.") to all counters -->
        <mapping matches="(.*)" rename-to="file_system.$1" />
  </counter>
</graphite-mr-counter>

        <ok to="end" />
        <error to="fail" />
    </action>

 <kill name="fail">
  <message>workflow failed</message>
  </kill>

  <end name="end" />

</workflow-app>
Let’s take a look at the action’s configuration that needs to be modified, starting with the action node properties:
  * **graphite-host** hostname/ip of your graphite server
  * **graphite-port** port your graphite server is listening on
  * **graphite-transport** Transport to use (TCP/UDP)
  * **metrics-path-prefix** common metrics prefix to use, we would recommend something like bundles.BUNDLENAME.coordinatorname
  * **nominal-time** the el-expression supplying the nominal time provided by the coordinator
Within the action you will find multiple counter nodes, one for each counter group we want to push into graphite:
 <counter>
	<source>${hadoop:counters('mr-job')['org.apache.hadoop.mapred.Task$Counter']}</source>
	<!-- this mapping will add a prefix ("mr_framework.") to all counters -->
	<mapping matches="(.*)" rename-to="mr_framework.$1" />
  </counter>
“hadoop:counters(‘mr-action-node-name’)[‘counter-group-name’]” is a oozie-provided EL function, that returns a json representation of a counter group from a specific mapreduce action.So you will need to adjust the “mr-job” part of the hadoop:counters() call to your actual mapreduce action node name from the workflow.
The sample action will grab all counters from “File System Counters”, “Job Counters”, and “Map-Reduce Framework” you already know from your jobtracker-UI by using the actual internal group names, so leave the counter group names untouched.
configure carbon
Your default carbon storage configuration will most probably not match your coordinator frequency, so make sure to add a proper configuration to your storage-schemas.conf matching your coordinator’s freqency (1 hour in this example):
[oozie_graphite_example_bundle]
pattern = ^oozie.bundle-name.coordinator-name.*
retentions = 1h:180d
Example graphs
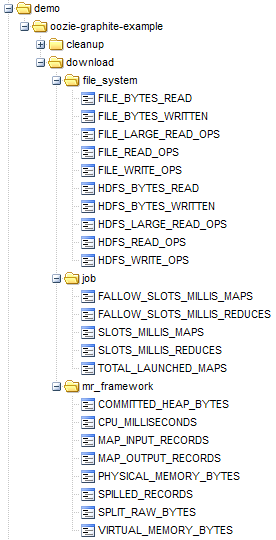
Your are all set, just deploy your enhanced bundle and take a look at the new metrics in your metrics tree. These example screenshots are taken from an simple bundle called “oozie-graphite-example” with two coordinators (download and cleanup):
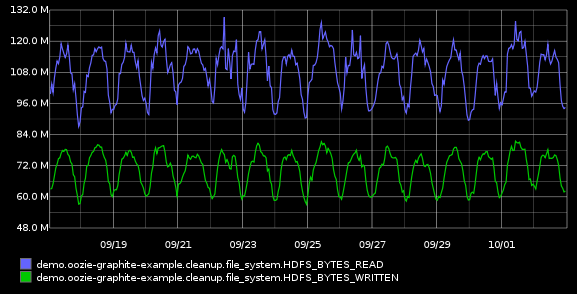
Let’s start visualizing workflow input / output volume of the cleanup coordinator actions by picking HDFS_BYTES_WRITTEN and HDFS_BYTES_READ :
[av_notification title=’’ color=‘green’ border=’’ custom_bg=’#444444’ custom_font=’#ffffff’ size=‘normal’ icon_select=‘no’ icon=‘ue800’ font=‘entypo-fontello’]
Please note that the timeline of these charts is based on the nominal time of your coordinator actions. It’s the timeline for which the processing was done, not when the processing actually occured![/av_notification]
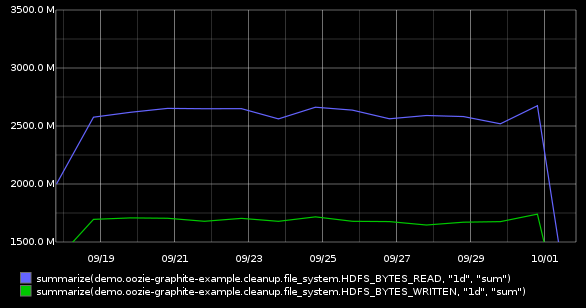
The data volume changes significantly during the day, so let’s summarize the data to daily values by applying the function summarize() to get a better long term view:
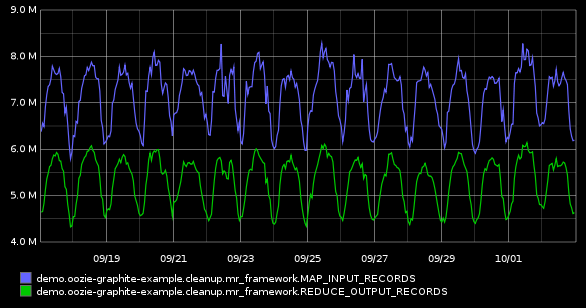
Or perhaps you are interested in the number of records read from input (MAP_INPUT_RECORDS) and written into output (REDUCE_OUTPUT_RECORDS) within the cleanup action:
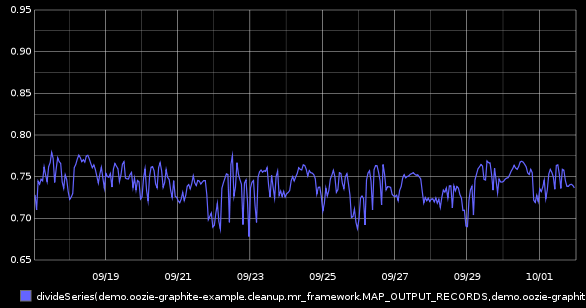
That is a nice input/output visualisation, but we can do better by leveraging graphite’s divideSeries() function to get the percentile of data passing thru:
divideSeries(demo.oozie-graphite-example.cleanup.mr_framework.MAP_OUTPUT_RECORDS,demo.oozie-graphite-example.cleanup.mr_framework.MAP_INPUT_RECORDS)